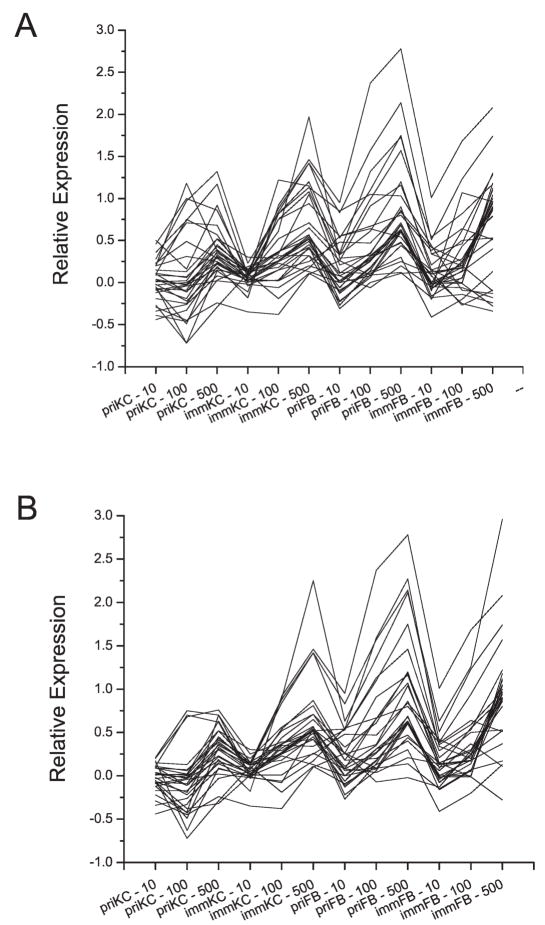
FIG. 5.
Expression profiles of the genes identified by GSEA analysis where the correlation of the expression profile to the ionizing radiation dose was used to identify enriched gene sets. Panel A: P53_ALL gene set match; panel B: BLEO_ HUMAN_LYMPH_-HIGH_4HRS_UP gene set match. Listings of the specific genes can be found in the supplementary tables. Cell types and doses are annotated as in Fig. 2.

