Fig. 4.
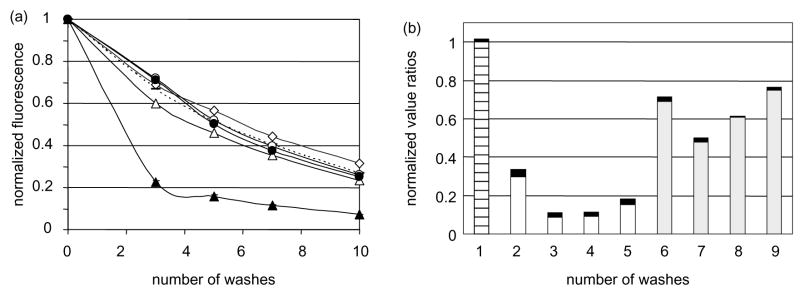
Cross-linked Meso-Ig and anti-CA125 mAb block cell adhesion (a) The cell adhesion assay was conducted in presence of 10 μg/ml of MPF-Ig alone (white circles) or cross-linked with anti-Ig mAb (black circles), or Meso-Ig alone (white triangles) or cross linked (black triangles). As a positive control for cell attachment, the assay was performed in medium only (white diamonds) or in medium supplemented with anti-hIg (dotted line). The assays were performed in triplicates. All standard deviations were less than 4%. (b) The cell adhesion assay was conducted after preincubation of OVCAR3 cells with 10 μg/ml of anti-CA125 antibodies (2=M002203; 3=M11; 4=M8072321; 5=X52; 6=M002201; 7=OC-125; 8=M8072320; 9=X306). The normalized fluorescent signals after five washes were divided by the fluorescent signal of the adhesion assay performed in medium only (1). The gray bars correspond to the anti-CA125 mAb of group A and the white bars to the group B. The black boxes represent the standard deviations and the stripped bar is the positive control for cell attachment.

