
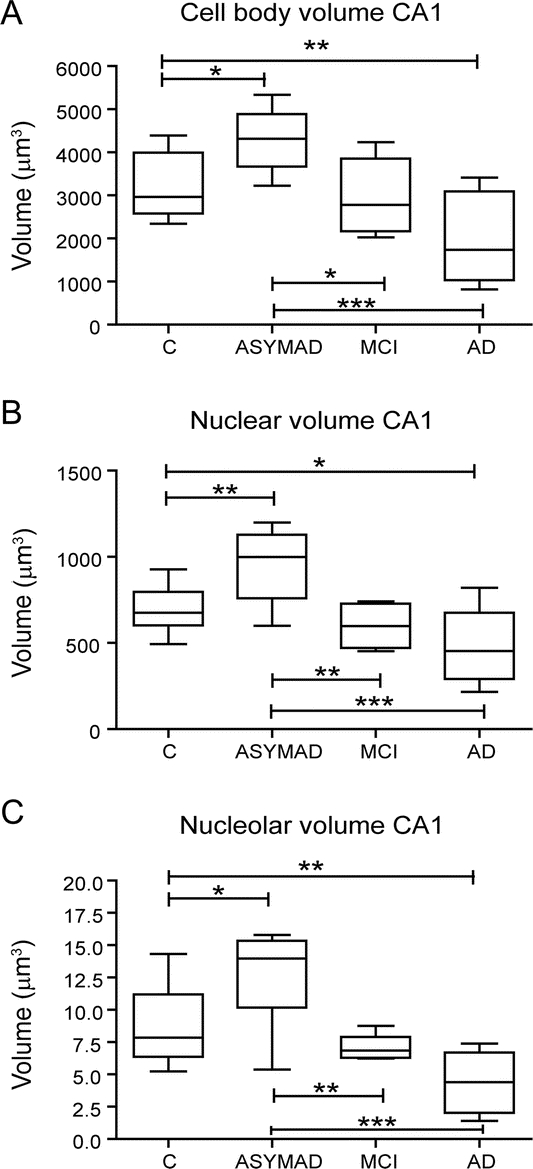
Figure 3 Cell bodies, nuclei, and nucleoli volumes in CA1 neurons of controls, asymptomatic Alzheimer disease (ASYMAD), mild cognitive impairment, and Alzheimer disease
Box plots showing the volumes of the (A) cell bodies, (B) nuclei, and (C) nucleoli of CA1 neurons. Note the marked and significant hypertrophy of cell bodies, nuclei, and nucleoli in ASYMAD compared with other groups. *p < 0.05, **p < 0.01, ***p < 0.001. The bar across the box is the median. The lowest and highest lines at the end of the whiskers correspond to the smallest and the largest sample values.