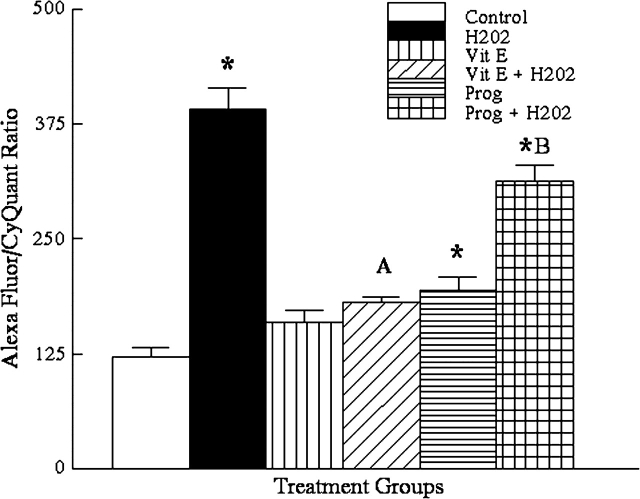
FIG. 3.
Results of DNA adduct assay for 72-h treated OSE cells showing the effect of vitamin E and progesterone on H2O2 induced oxidative stress DNA adducts (Vit E = vitamin E; prog = progesterone; other abbreviations as in Fig. 1). Asterisks indicate significant elevations from control (H2O2, n = 8, p ≤ 0.01; prog, n = 8, p ≤ 0.01). The letter A indicates no significant difference between vitamin E alone and vitamin E + H2O2 (n = 8, p = 0.88). The letter B indicates a significant difference between progesterone alone and progesterone + H2O2 (n = 8, p ≤ 0.01).

