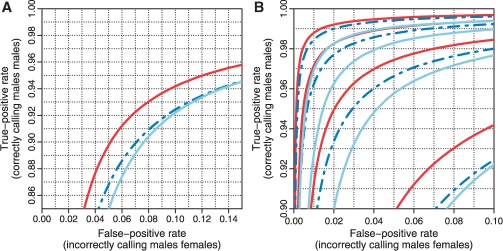
Fig. 1.
ROC curves showing that CRMA v2 (solid red) separates CN = 1 from CN = 2 (ChrX) better than CN5 (dashed blue) and dChip* (solid light blue) at the full resolution (H = 1; A) as well as at various amounts of smoothing (H = 1, 2, 3, 4; B). The curves for H = 1 are in the lower right corner and the curves for H = 4 are in the upper left corner.

