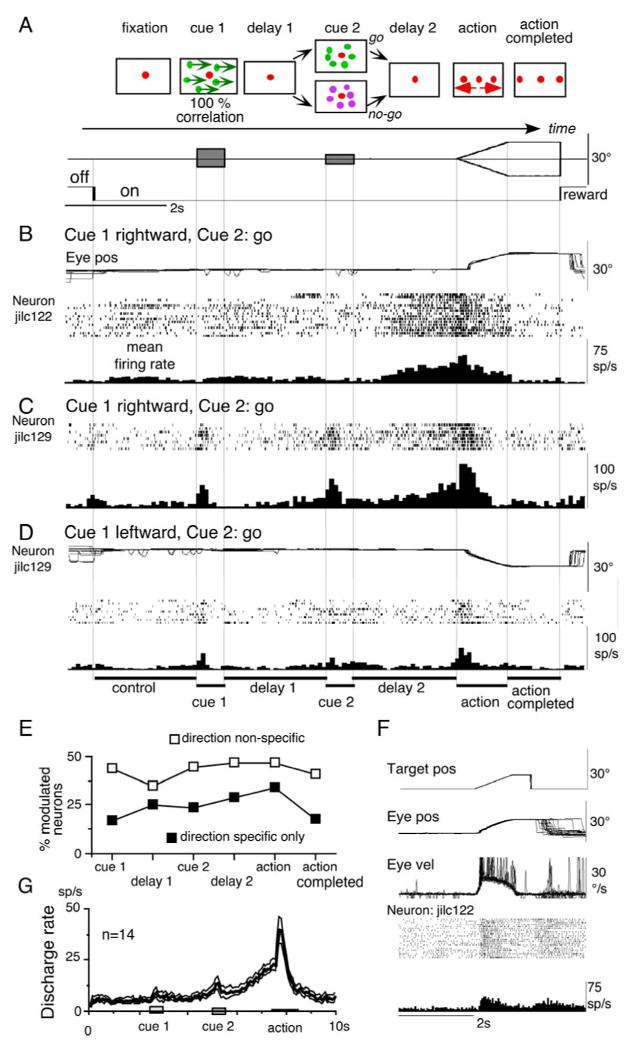
Fig. 1.

Task conditions and discharge of SEF neurons. A, task conditions. B-D, spike rasters and averaged histograms of 2 SEF neurons during go trials as indicated. Top traces in B and D are superimposed eye position (eye pos). E, percentage of modulated neurons that preferred go trials during different task periods. F, discharge of the same neuron shown in B during a simple ramp-tracking task of a single spot. Saccade velocities (eye vel) are clipped. G, mean (±SE) discharge of movement preparation neurons. See text.
