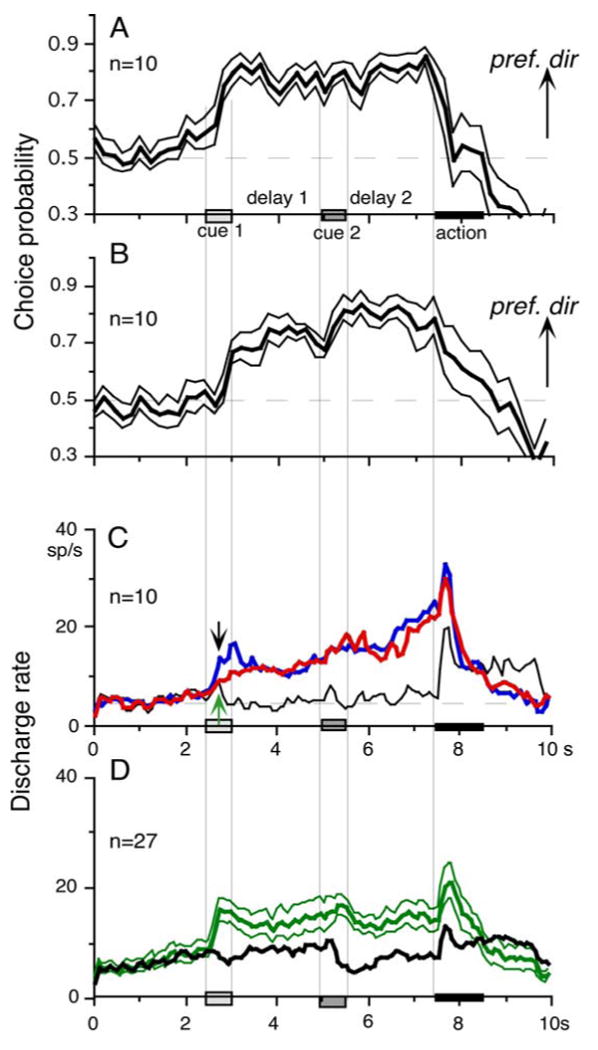
Fig. 4.

Time course of choice probability (CP) for go trials, mean (±SE) discharge modulation. A, B plot mean (±SE) CP of 10 visual memory + movement preparation during go trials sorted on pursuit in the preferred directions during delay 2 when cue 1 was 100 % (A) and 0 % correlation (B). C, blue and red traces compare mean discharge rates of the 10 neurons in preferred directions during go trials when cue 1 was 100 % (blue) and 0 % correlation (red). Black trace is mean discharge rate of the same neurons during go trials in anti-preferred directions when cue 1 was 0 % correlation. Dashed horizontal, gray lines in A and B are CP 0.5 values. Dashed line in C is mean discharge rate during control fixation period. In D, we selected SEF neurons that exhibited directional response to cue 1 visual motion and compared their mean discharge rates when the monkeys performed the pursuit instructed by cue 1 (i.e., preferred directions for cue 1) or anti-preferred directions.
