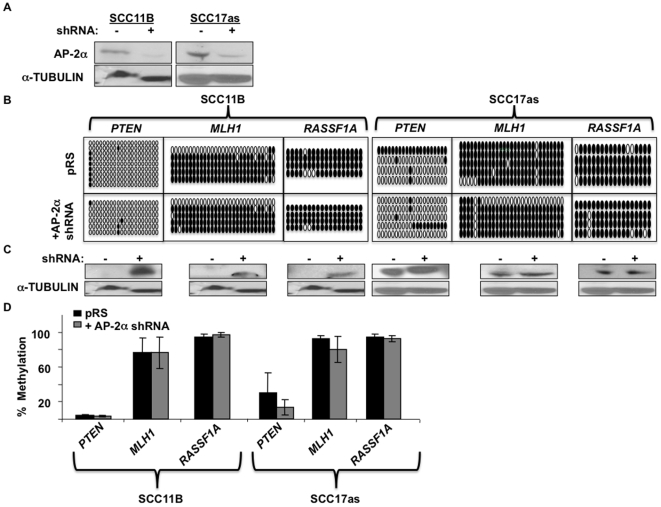
Figure 2. Varied target methylation and expression following AP-2α downregulation in HNSCC cell lines SCC11B and SCC17as.
a) Western blot analysis to confirm AP-2α downregulation in SCC11B and SCC17as. b) Methylation in 3 target genes was compared between SCC11B and SCC17as cells with and without AP-2α expression. Solid circles represent methylated CpGs; whereas, open circles represent unmethylated CpG sites. c) Western blot analysis was performed to analyze methylation's affect on target expression. d) Graphical representation of the average methylation percentage in the 3 target genes analyzed.

