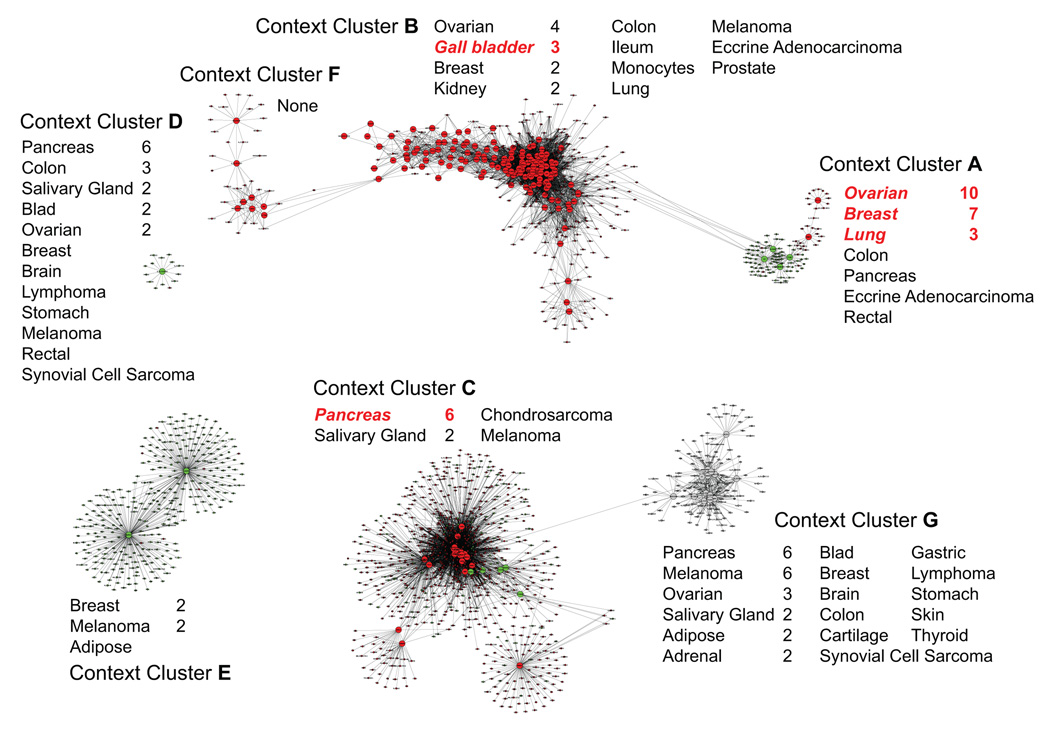
Figure 1.
Context-clusters and context-specific GRNs – each context cluster is annotated with the corresponding set of samples and highlights significantly enriched tumor types in red. See Table 1 for cancer tumor sample distribution in the dataset. In the graph itself, red vertices represent over-expressed genes, green under-expressed, and grey neither under- nor over-expressed. Edges are oriented from driver genes (large vertices) to driven genes (small vertices).

