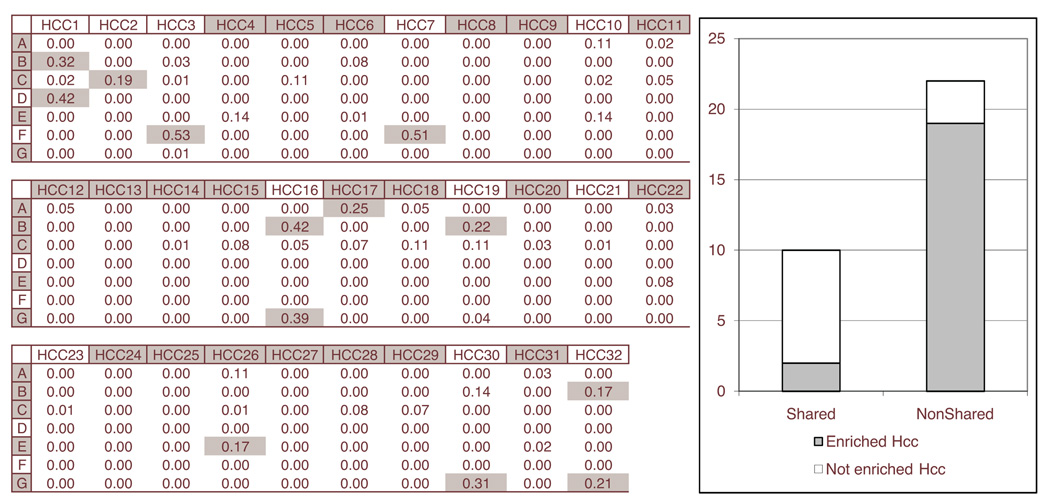
Figure 2.
The left table shows the degree of overlap for each pair of a context cluster (A ~ G) and a subgraph (HCC,1 ~ HCC,32) from Bayesian network analysis. A shaded cell in the table represents the pair with significantly shared genes. A shaded context cluster or a HCC has at least one enriched GO term while non-shaded one has no enriched GO term. The right graph shows the portion of HCCs with enriched GO terms for HCCs with significantly shared genes (Shared) and HCCs with no significantly shared genes (NonShared).

