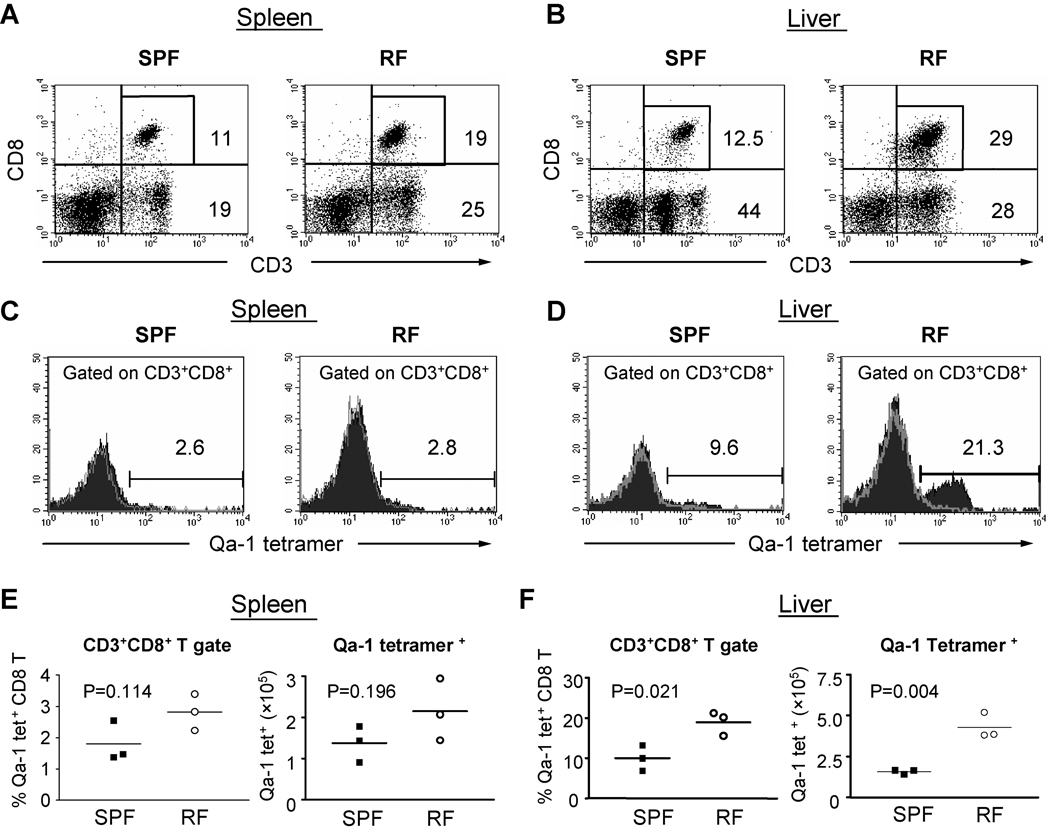
Figure 8. CD8+ T cell binding of Qa-1 tetramer/heat shock peptide.
Single cells were isolated from adult C57BL/6 spleen (A, C, E) and liver (B, D, F) of age- and gender-matched adult RF and SPF mice and stained for CD3, CD8+ and Qa-1b tetramer loaded with the murine HSP60 monamer GMKFDRGYI. Flow cytometry from single RF and SPF animals are shown in (A–D), representative of findings from three different experiments. (A, B) CD3 and CD8 expression. (C, D) Level of Qa-1 tetramer binding by CD8+ T cells. Histograms show staining with Qa-1/tetramer (filled) and unstaining negative control (grey trace). (E, F) Tabulated percentage and absolute number of Qa-1 tetramer-binding CD8+ T cells. The data represents the results from three individual experiments.

