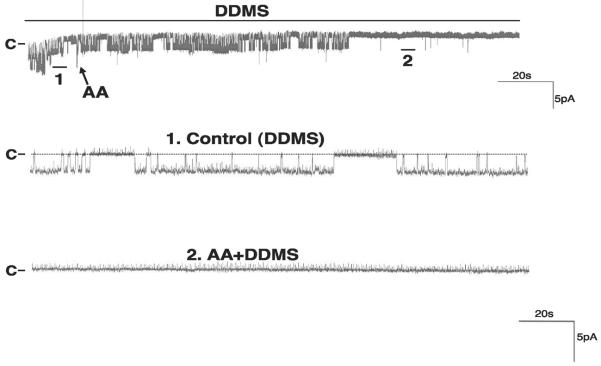
Fig. 3.
Channel recording demonstrating the effect of AA (10 μM) on the basolateral 18-pS K channels in the presence of DDMS (5 μM). The experiment was conducted in a cell-attached patch with 0 mV holding potential. The trace on top shows the time course of the experiment, and two parts of the recording indicated by nos. are extended at a fast time resolution. The addition of AA is indicated by an arrow, and channel closed level is indicated by C or a dotted line.

