
Figure 8.
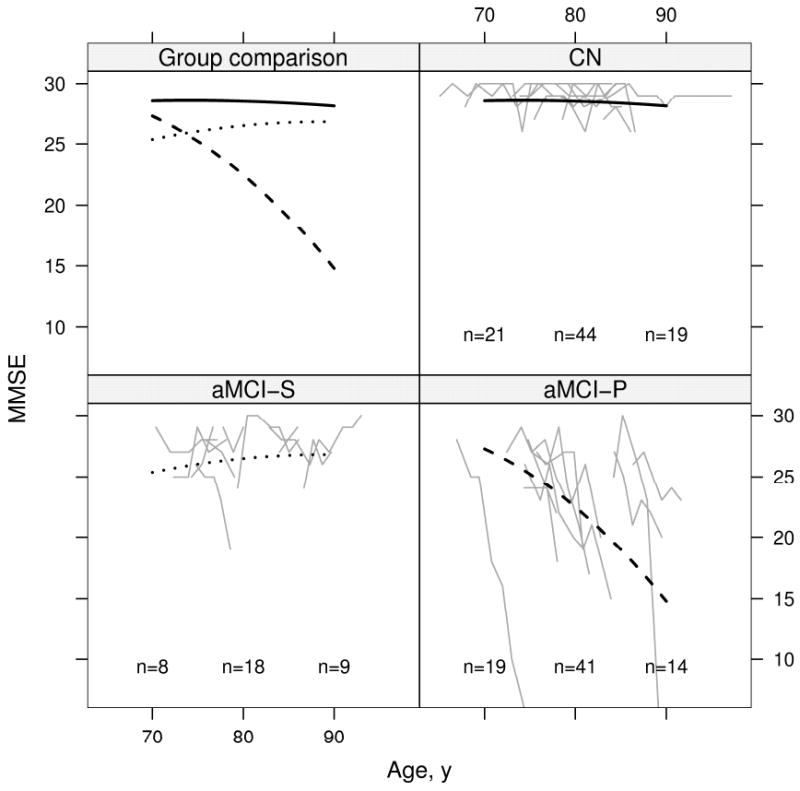
Change in MMSE with age by group. Thin gray lines represent individual subject scores over time. The solid black line represents the estimated average for CN, the dotted black line represents the estimated average for aMCI-S, and the dashed black line represents the estimated average for aMCI-P. Average scores are calculated assuming a woman with 12 years of education whose index scan is at age 79. To better see individual trajectories, random subsets of 10 subjects in each group are shown. The number of subjects included in the analysis within 5 years of 70 years, 80 years, and 90 years are indicated within the panel.