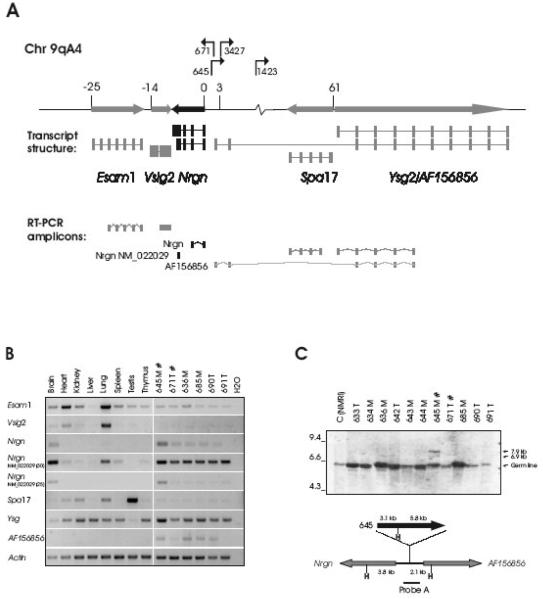
Fig. 1. Proviral integrations in the Esam1/Vsig2/Nrgn/Ysg2/Spa17-locus activate Nrgn expression in T-cell tumors.
A. The proviral positions and transcriptional orientations in the locus are shown with arrows. The relative position of the transcription start sites of the genes are given in kb and a schematic mRNA structure is depicted with exons as bars. Both a long (NM_022029) and a short (BC061102) transcript form of Nrgn is shown in black. The RT-PCR amplicons are drawn below. B. RT-PCR on RNA from a panel of tissues from non-infected mice (lanes 1-8) as well as six independent mesenteric (‘M’) and thymic (‘T’) tumors induced by SL3-3(turbo) (lanes 9-14). Tumors with integration into the Nrgn locus are indicated with ‘#’. For the ‘NM_022029’ amplicon PCR amplification products with 25 and 30 cycles are shown. C. Southern blotting on HindIII-digested tumor DNA using Probe A (top panel). Positions of the germ line band as well as the sizes of the expected rearranged bands (6.9 kb and 7.9 kb) are indicated with arrows. The position of Probe A across the integration sites between Nrgn and AF156856 is depicted schematically together with HindIII sites (‘H’), and the distances in kb between HindIII positions and the integration site (bottom panel). For clarity, only the clonal provirus in tumor 645 is depicted. ‘T’ and ‘M’ designates a thymic or mesenteric lymph node tumor, respectively.

