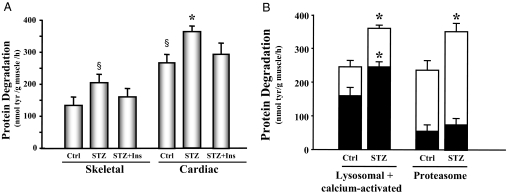
Figure 1.
Protein degradation is elevated in the cardiac muscle of STZ-treated diabetic mice. A, Protein degradation was measured as tyrosine (tyr) release from isolated skeletal and cardiac muscle from control (Ctrl), diabetic (STZ), or insulin-treated diabetic (STZ+Ins) mice. The protein degradation rates are depicted in the bar graph and represent the means ± se (n = 9 per group). §, P < 0.05 vs. skeletal muscle control; *, P < 0.05 vs. cardiac muscle control. B, Protein degradation was measured as tyrosine release from isolated cardiac muscle from control or diabetic (STZ) mice. The entire bar (white and black) represents total protein degradation. Black bars represent the remaining degradation activity after inhibition of the lysosomal plus calcium-activated proteolytic pathways (left) or proteasome proteolytic pathway (right). Therefore, the white portions of the bars only indicate the activities of the degradation pathways specified below the bars. Data are reported as the means ± se (n = 6 per group). *, P < 0.05 vs. control.

