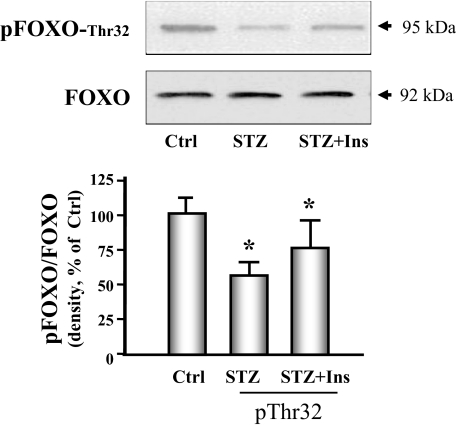
Figure 8.
FOXO phosphorylation is decreased in cardiac muscle of diabetic mice. FOXO phosphorylation was measured by Western analyses using phosphospecific anti-pFOXO-Thr32 in control (Ctrl), diabetic (STZ), or insulin-treated diabetic (STZ+Ins) mice. The bar graph shows the ratio of phospho-FOXO to FOXO band densities reported as a percent of control values. Data are reported as the means ± se (n = 6 per group). *, P < 0.05 vs. control.

