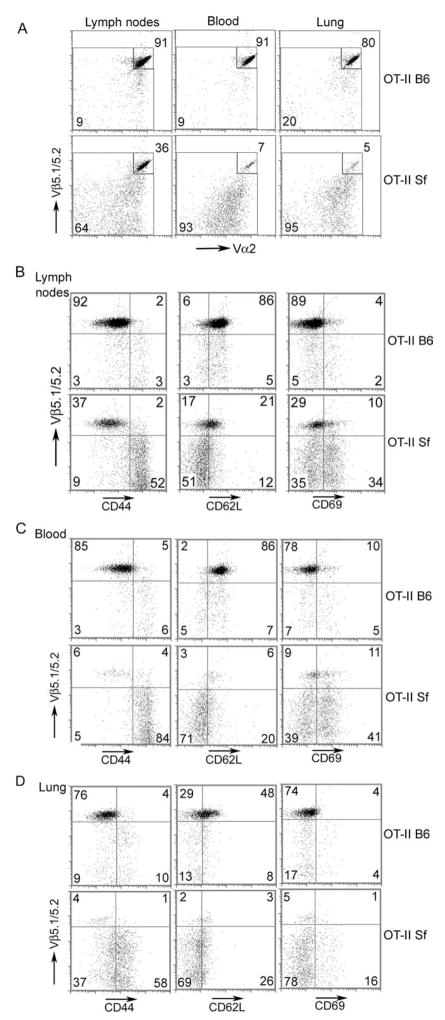
FIGURE 3.
Tissue distribution and cell surface phenotype of T cell populations compared between OT-II B6 and OT-II Sf mice. Single-cell suspensions were prepared from pooled lymph nodes, blood, and lungs from 4-wk-old OT-II B6 and OT-II Sf mice as previously described (19). Cells were doubly stained with anti-Vβ5 and anti-Vα2 mAb (A). Vβ5highVα2high expression was reduced from 91 to 36% for lymph nodes, 91 to 7% for blood, and 80 to 5% for lung. Cells were also stained with a mixture containing allophycocyanin-Alexa Fluor750-anti-CD4 mAb, PE-anti-Vβ5, and various FITC-mAb including CD44, CD69, and CD62L (B–D). Expression of cell surface markers was analyzed on CD4-gated cells. Clonotypic T cells as defined by Vβ5high displayed the TN phenotype and were present more in the lymph nodes, whereas TM/TE cells (CD44highCD62Llow) that were significantly increased in the Vβ5int/neg T cells in the OT-II Sf mice were more frequently observed in the blood and inflamed lungs. The data shown are representative of two experiments. At least two mice in each group were examined for each experiment.

