
Fig 1.
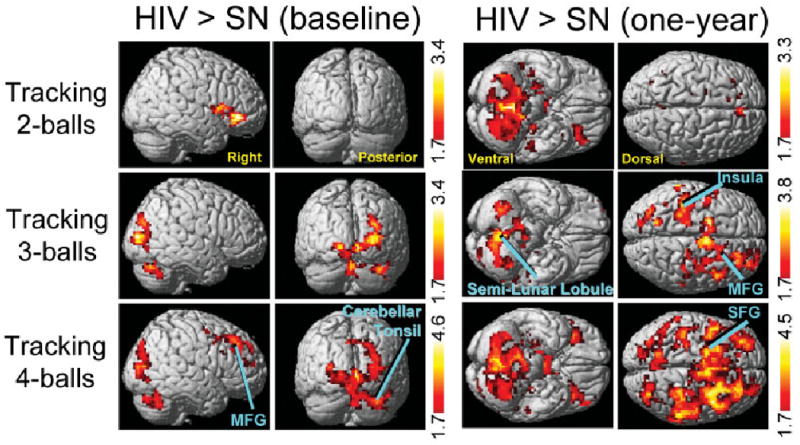
Statistical parametric maps showing significantly greater brain activation in human immunodeficiency virus (HIV) than seronegative (SN) participants (unpaired t test) for the two- (top), three- (middle), and four-ball tasks (bottom) at the baseline examination (left) and 1-year follow-up (right). Compared with SN participants, the HIV group showed significantly greater activation only with the 4-ball task at baseline [cluster maxima: medial frontal gyrus (MFG: 18, 30, 27), p corrected < 0.0001, 2,149 voxels; cerebellar tonsil/occipital (36, −63, −33), p corrected < 0.02, 1,446 voxels)], but with all 3 tasks at the 1-year time point [2 balls: large cluster with maximum at claustrum (−21, 24, 9), p corrected < 0.0001, 6,416 voxels (only cerebellar activation visible); 3 balls: MFG (6, −3, 60), p corrected < 0.002, 1,813 voxels; insula (−36, −27, 21), p corrected < 0.008, 1,403 voxels; and cerebellar semilunar lobule (0, −63, −36), p corrected < 0.0001, 1,894 voxels; 4 balls: large cluster with maximum at superior frontal gyrus (SFG, −9, 6, 69), p corrected < 0.0001, 16,612 voxels]. Z-scores shown in the red-yellow color bars indicate significance (p < 0.05) at the voxel level. Labeled clusters are significant after correction for multiple comparisons (cluster level, p < 0.05), whereas unlabeled clusters were significant at the voxel level (p < 0.05), all clusters greater than 300 voxels.