
Fig 2.
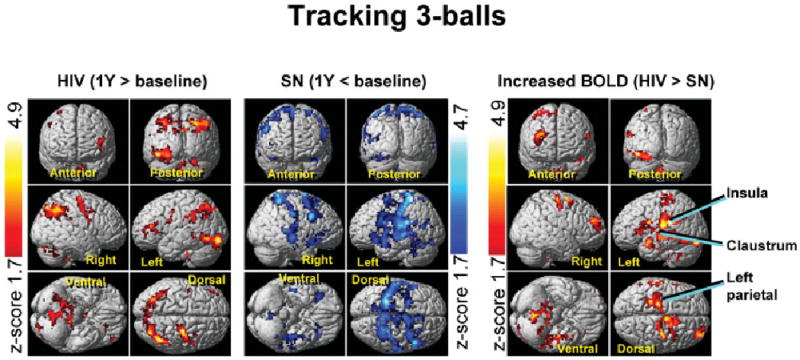
Statistical parametric maps of changes in brain activation over the course of 1 year for human immunodeficiency virus (HIV)–positive (left) and seronegative (SN) controls (center) for the three-ball tracking task. Significant blood oxygen level dependent (BOLD) signal increases are indicated by Z-scores shown in the red-yellow scale and decreases by Z-scores on the blue-white scale. The HIV group shows only increases in brain activation, whereas the controls show only signal decreases after 1 year. The opposite changes led to significant interactions in brain activation between HIV status and time, with greater 1-year BOLD signal increases in HIV patients compared with SN controls (right). These findings suggest a practice effect in the controls but neural compensation in the HIV group to maintain performance. Clusters with greater than 300 voxels and p corrected < 0.05 (voxel level) are shown.