
Fig 4.
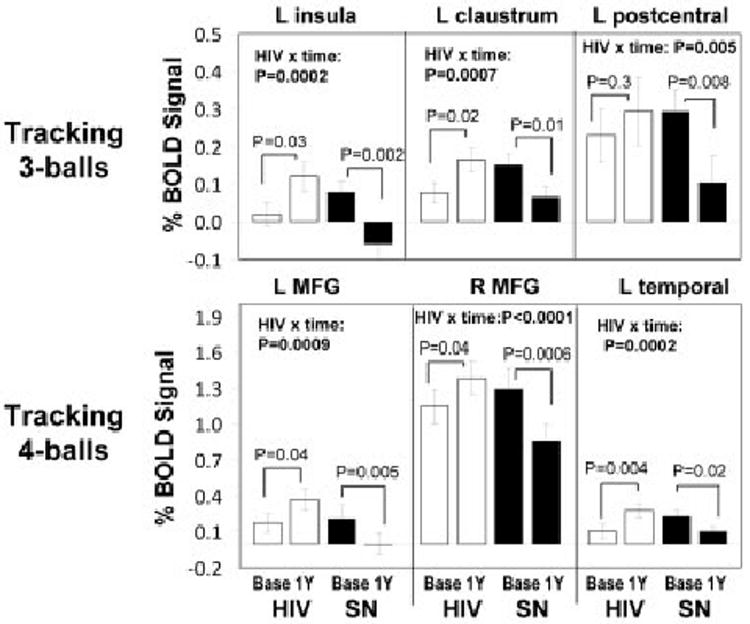
(top) Extracted blood oxygen level dependent (BOLD) signal amplitudes centered at 3 major cluster maxima that showed interaction effects for human immunodeficiency virus (HIV) status and time for the 3-ball tracking task: left insula (−36, −27, 21), left claustrum (−20, 3, 18), and left postcentral gyrus (−57, −21, 24). (bottom) Extracted BOLD signal amplitudes centered at three major cluster maxima that showed an interaction effect of HIV status and time for the 4-ball tracking task: left middle frontal gyrus (L MFG: −51, 30, 24), right middle frontal gyrus (R MFG: 33, 6, 63), and left temporal subgyral (−48, −48, −6). The extracted data confirm the findings of the Statistical Parametric Mapping analysis, with significant (p corrected < 0.005) HIV status × time interactions, using repeated-measure analysis of variance. Post hoc paired t tests were used to compare baseline and 1-year data in each group.