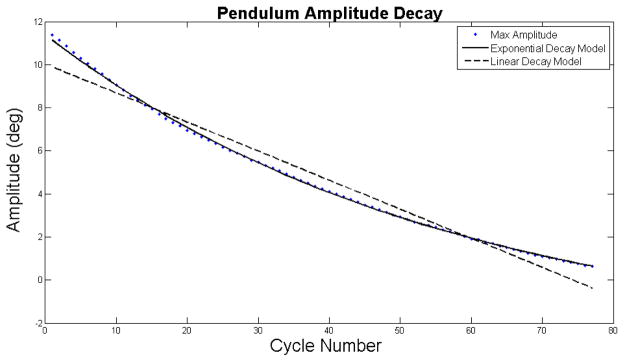
Figure 3.
Representative plot of the Lin μ (dashed line) and Exp μ (solid line), which accounts for viscous damping fit to the maximum amplitudes points for each cycle. The Exp μ model provided a much closer fit to the experimental data with a RMSE of 0.078° and an ASE of 0.033°, versus the Lin μ RMSE of 0.55° and ASE of 0.185°

