
Figure 3.
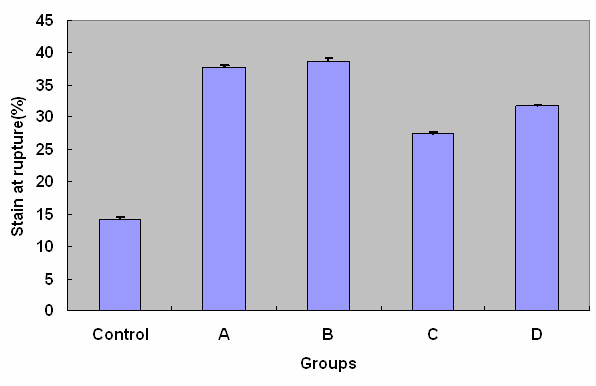
The comparison of strain at rupture of each group. The differences between control and each experimental group were statistically significant (P < 0.05).
Official websites use .gov
A
.gov website belongs to an official
government organization in the United States.
Secure .gov websites use HTTPS
A lock (
) or https:// means you've safely
connected to the .gov website. Share sensitive
information only on official, secure websites.
The comparison of strain at rupture of each group. The differences between control and each experimental group were statistically significant (P < 0.05).