Figure 4.

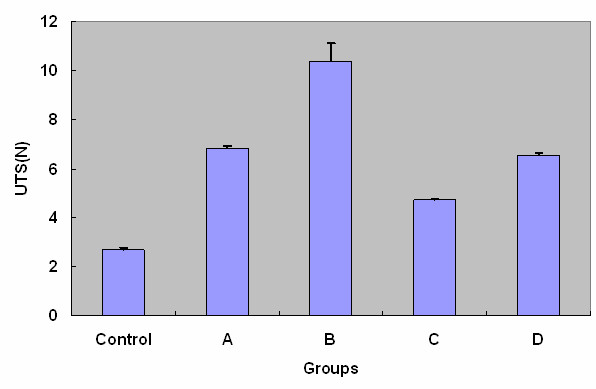
The comparison of ultimate tension strength (UTS) of each group. The differences between control and each experimental group were statistically significant (P < 0.05).

The comparison of ultimate tension strength (UTS) of each group. The differences between control and each experimental group were statistically significant (P < 0.05).