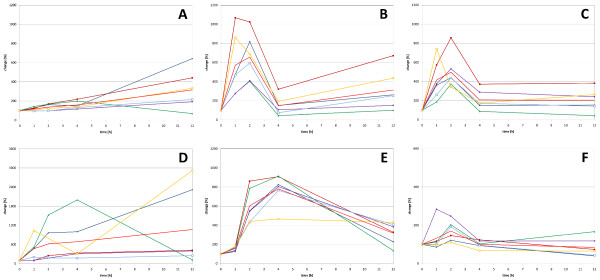
Figure 2.
Gene expression time courses following TGFβ1 or TNFα treatment. COL1A1 (A), JUNB (B), and SMAD7 (C) gene expression in response to TGFβ1 treatment (upper row); TNFα response (lower row) of NFKB1 (D), MMP1 (E), and SMAD7 (F). The average time course is shown as light red curve without symbols, the data for individual samples are depicted in other colours (OA1: blue, filled symbol; OA2: red, filled symbol; OA3: green, filled symbol; RA1: purple, filled symbol; RA2: blue, open symbol; RA3: yellow, open symbol). The time courses and the values calculated from the microarray experiments for all analysed genes are included in additional file 4.

