
Figure 1.
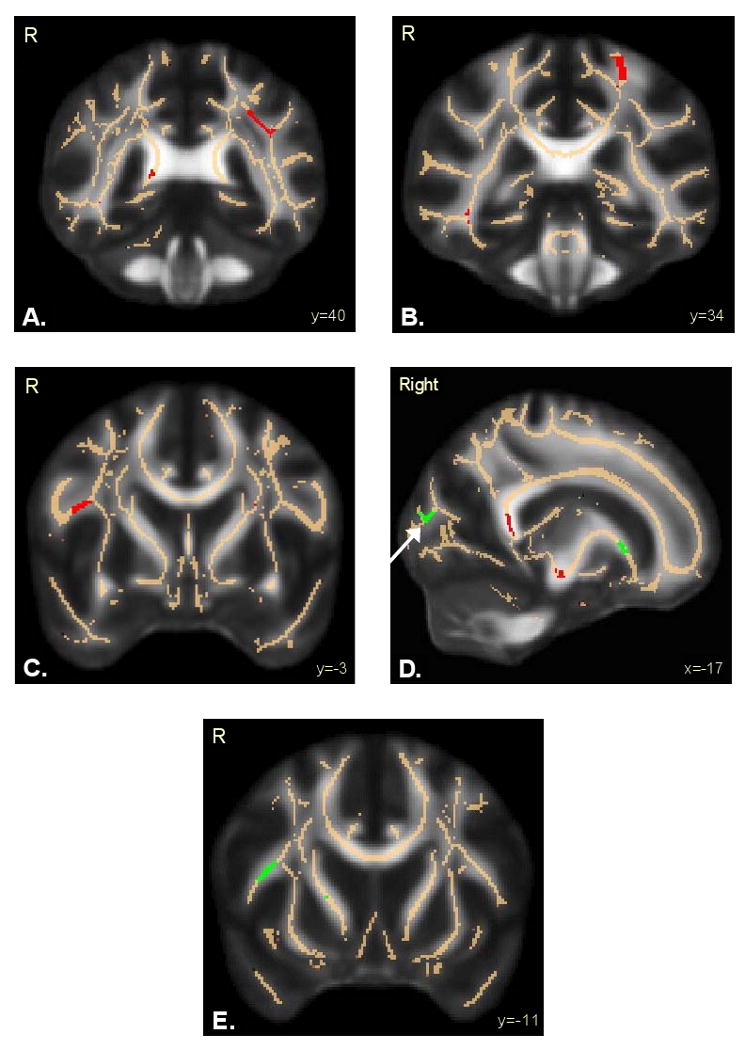
Regions of altered fractional anisotropy in adolescent marijuana+alcohol users (n=36) relative to controls (n=36). Results are superimposed on the fiber skeleton (beige) and overlaid on a standardized FA template. Red indicates decreased FA in marijuana+alcohol users in: A) left superior longitudinal fasciculus; B) postcentral gyrus; and C) inferior frontal gyrus. Green indicates increased FA in marijuana+alcohol users in: D) occipital lobe-cuneus (white arrow); and E) right superior longitudinal fasciculus – arcuate. R=Right.