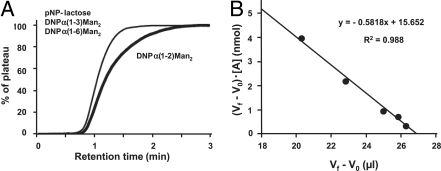
Fig. 3.
Analysis for Bt value determination of AH column. For evaluation of AH column, DNP-α(1–2)Man2 was diluted to various concentrations (5–200 μM) and applied to an AH-immobilized column. The thick and thin lines indicate elution profiles of DNP-α(1–2)Man2 and control sugar (pNP-lactose), respectively (A). Woolf–Hofstee type plots were made by using V − V0 values (B). For details, see main text.

