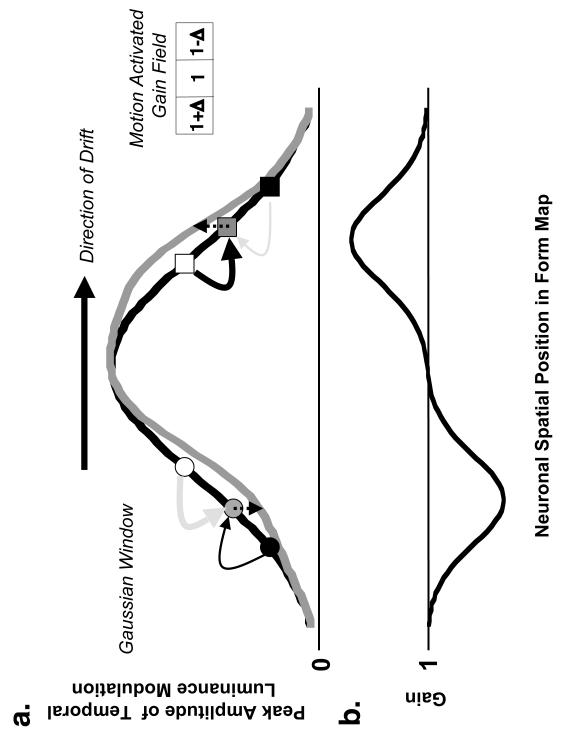
Figure 6.
Illustration of a motion activated gain field and its possible role in generating the MIPS. a. This figure illustrates the influence of a motion activated gain field (e.g. inset at top right) on the peak amplitude of temporal luminance modulation at various spatial locations in the form map produced by a Gaussian windowed drifting sinusoidal carrier (thick black curve). We assume that the gain of a neuron is the sum of all the gain change signals received from its neighbors, a concept similar to the combination of excitatory and inhibitory signals within receptive fields. Note that the gain change signals are activated by the retinotopically corresponding motion signals in a motion map (not shown). The long arrow at the top represents the direction of drift. The curved arrows represent the gain change (or control) signals that a single neuron receives from its neighbors. The thickness of the arrow represents the magnitude of the gain change signal. Black arrows represent gain-increase (amplification) signals while gray arrows represent gain-decrease (attenuation) signals. Two example locations are illustrated: one within the leading (filled gray square) and another within the trailing (filled gray circle) half of the drifting Gabor stimulus. At the location within the trailing half of the drifting stimulus (filled gray circle), the gain-increase signal is lower than the gain decrease signal and thus the net effect is to reduce the peak amplitude of luminance modulation at that location (downward dotted arrow). The opposite effect (upward dotted arrow) occurs for the location within the leading half of the drifting stimulus (filled gray square). The thick gray curve represents the peak amplitude of luminance modulation after the gain changes in the form map have reached steady-state (e.g. curve in b). This curve illustrates the distortion of the form map and the shift in centroid of the activity pattern, which leads to a shift in the perceived position of the drifting Gabor stimulus in the direction of motion. b. An example of the steady-state gains of the neurons in the form map. Gains are lower (greater) than unity within the trailing (leading) half of the drifting stimulus. The gain is minimum (or maximum) near the spatial regions where the slope of the Gaussian window of the drifting Gabor is steepest. Conversely, the gains are close to unity near the spatial regions where the slope of the Gaussian window of the drifting Gabor is close to zero. The thick gray curve in panel a is computed by multiplying the thick black curve in panel a by the gain curve in this panel. Note that for a rectangular window, the steady-state gains for all the neurons in the form map will be constant everywhere (if the gain increase signals truly balance the gain decrease signals, the gains will be close to unity) except in the small region at the stimulus edges.

