Figure 2f:
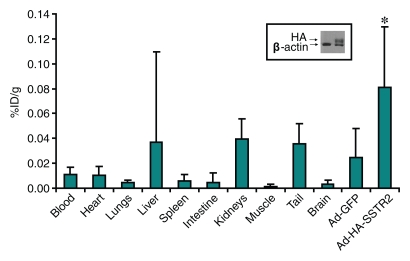
Imaging and ex vivo biodistribution data in L3.6pl tumors. Representative (a) white light and (b) gamma camera images of L3.6pl-bearing mice infected in vivo with Ad-HA-SSTR2. Left tumor was injected with Ad-GFP (arrowhead); right tumor was injected with Ad-HA-SSTR2 (arrow). Two days later, intravenous injection of 111In-octreotide followed. The next day, (a) white light and (b) gamma camera imaging were performed. Increased uptake was seen in tumors infected with Ad-HA-SSTR2 (arrow) on planar image. K = kidneys, N = nose. (c–e) MR images in mice bearing subcutaneous L3.6pl tumors. Axial (c) T2-weighted, (d) T1-weighted, and (e) contrast material–enhanced T1-weighted images at the level of the thorax show subcutaneous tumors (arrowheads). Areas of hemorrhage and/or necrosis (arrows) that cannot contribute to gene expression are seen as areas of increased signal intensity within the tumor (c) on T2-weighted image and as areas without enhancement (e) on contrast-enhanced T1-weighted image. (f) Graph shows ex vivo biodistribution of 111In-octreotide in mice bearing subcutaneous L3.6pl tumors injected in vivo with Ad-HA-SSTR2 or control virus. After gamma camera imaging, tumors were excised for ex vivo biodistribution analysis. Increased uptake was seen in tumors infected with Ad-HA-SSTR2. Inset: Western blot results in tumors with anti-hemagglutinin A antibody for the expressed HA-SSTR2 fusion protein and with anti-β-actin antibody for the housekeeping protein β-actin. * = P < .027, n = 6, t test comparing tumors infected with Ad-HA-SSTR2 and those infected with Ad-GFP. %ID/g = percentage of injected dose per gram. Error bars = standard deviation.

