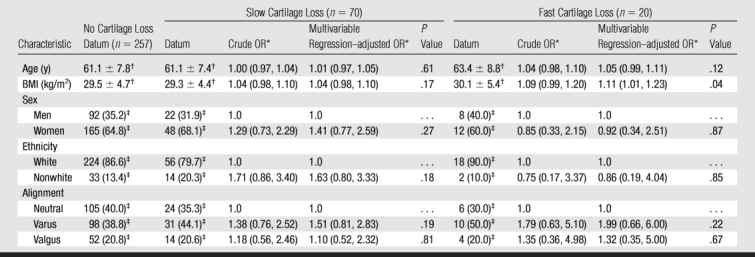
Table 2.
Associations between Cartilage Loss and Baseline Demographic Characteristics

Note.—OR = odds ratio.
* Data are ORs, with 95% confidence intervals (CIs) in parentheses. Characteristics with an OR of 1.0 were used as reference.
† Data are mean ± standard deviation.
‡ Data are number of knees, with percentage in parentheses.
