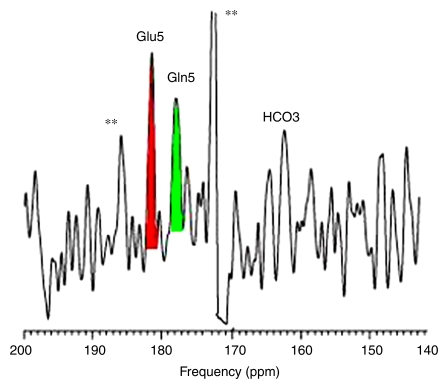
Figure 2b:
Cerebral metabolism of [2-13C]–glucose in (a) healthy control subject with normal brain glutamate C5, glutamine C5, and bicarbonate (b) and representative OTCD patient with similar 13C metabolites. Difference spectra were created by subtraction of natural-abundance from enriched-brain spectra acquired 40–60 minutes after [2-13C]–glucose infusion. ** = Artifacts of difference spectroscopy. Keys are same as for Figure 1.

