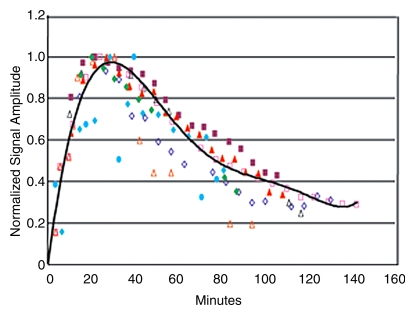
Figure 3a:
Effects of OTCD on cerebral metabolism of 13C-glucose and glutamate (Glu). (a) Comparative rates of cerebral accumulation and removal of infused [1-13C]– and [2-13C]–glucose in OTCD (open symbols) and healthy (solid symbols) subjects. Proton-decoupled spectra were acquired from posterior parietal brain in nine subjects (five OTCD patients and four healthy control subjects) for 2 hours after enrichment by means of intravenous glucose (Glc) (0.15 g/kg) enriched in either C1 (n = 5) or C2 (n = 5) position. Both isotopes of glucose showed rapid increase to peak brain 13C-glucose at 20 minutes or longer and slower elimination by 120 minutes. No significant differences between C1 and C2 or between OTCD patients and healthy subjects were observed (numeric rates and P values are in text). (b) Relative rates of cerebral enrichment of glutamate from 13C-glucose in OTCD patients and control subjects. Box plots of rates of glutamate enrichment from glucose C1, glucose C2, and combination of glucose C1 and C2 in OTCD patients and control subjects. Metabolic product is Glu4/Glc1 for glucose C1, where Glc1 = glucose C1 and Glu4 = glutamate C4, Glu5/Glc2 for glucose C2, where Glu5 = glutamate C5 and Glc2 = glucose C2. Metabolic product is Glu4,5/Glc1,2, where Glu4,5 = glutamate C4 and C5 and Glc1,2 = glucose C1 and C2; results for glucose C1 and C2 (C1 + C2) were pooled. Glu* = glutamate C4 or C5 and Glc* = glucose C1 or C2. Time course of appearance of [1-13C]–glucose and glutamate in brain of representative (c) control subject and (d) OTCD patient. Proton-decoupled 13C brain spectra were acquired in 6-minute blocks for 100 minutes after intravenous infusion of [1-13C]–glucose. Peak heights of glucose (Glc), glutamate C4 (Glu4), and glutamate C2 (Glu2) were plotted. Enrichment of brain glucose precedes glutamate C4 (first turn), which in turn precedes enrichment of glutamate C2 (second turn). From slopes of linear line–fit Glu4/Glc1, where Glu4 = glutamate C4 and Glc1 = glucose C1, versus time (and Glu5/Glc1 vs time, where Glu5 = glutamate C5) in all subjects; the rates of glutamate formation in OTCD patients were lower than in healthy control subjects, as on b.

