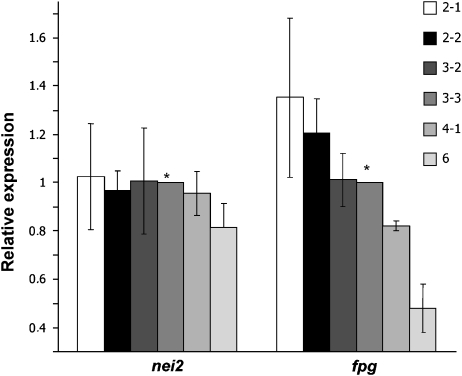
Fig. 5.
Expression analysis of Mycobacterium tuberculosis Mtb-fpg1. Analysis of the relative expression of Mtb-fpg1 and nei2 (Rv2464c) mRNA in M. tuberculosis strains containing different TRTs upstream of the Mtb-fpg1. Data are expressed as fold change relative to M. tuberculosis H37Rv Mtb-fpg1 or nei2 expression when normalized to sigA. Data represent the average of six independent experiments. Error bars indicate SE of the mean. TRT as in Fig. 3c. Strains: 2-1, NLA0001000560; 2-2, NLA009801353; 3-2, NLA009802122; 3-3, H37Rv; 4, NLA 009700438; 6, 29593. *Calibrator.

