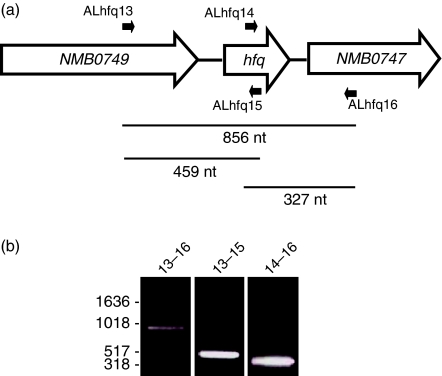
Fig. 2.
Transcriptional analysis of the Hfq operon. (a) Schematic representation of the Hfq polycistronic operon. Primers used in RT-PCR are indicated in black arrows. The size of the calculated RT-PCR products is indicated below the black lines. (b) RT-PCR results. Products obtained by RT-PCR were separated on agarose gel. Numbers on the left represent marker sizes; primer pairs used in the RT-PCR are indicated above the lanes. Reactions in which the addition of reverse transcriptase was omitted did not yield any products (not shown).

