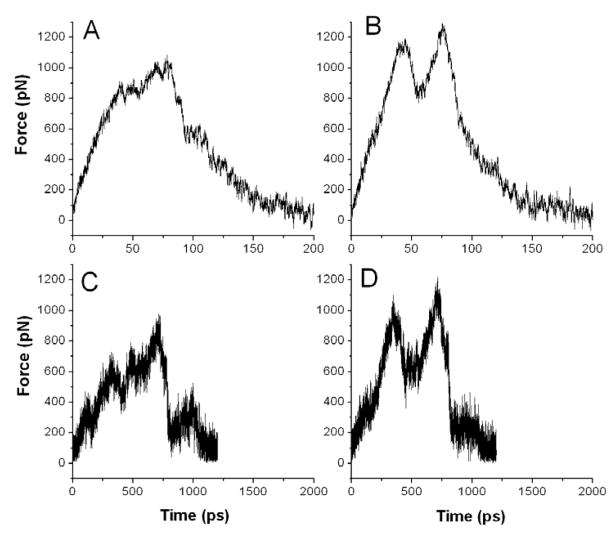
Figure 2.
SMD simulation results using two different pulling speeds, 0.125 A/ps (A and B) and 0.0125 A/ps (C, and D) for the monomeric (A, and C) and the dimeric (B, and D) forms of RacE2, respectively. A and B were generated by averaging 10 different SMD runs using 10 different starting structures that were selected at a time interval of 100ps from a molecular dynamics simulation run after the system had reached equilibrium. C and D were generated by averaging 3 different SMD runs using 3 different starting structures selected at a time interval of 200 ps from the equilibrium phase of the molecular dynamics simulation. Figs 1A, B are plotted on a 10-fold expanded time scale compared with C and D to compensate for the 10-fold difference in pulling rates.

