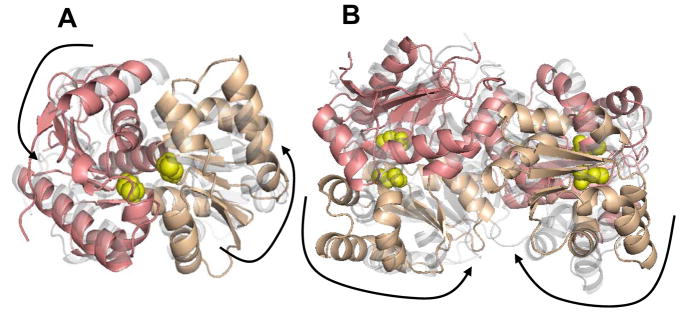
Figure 3.
Normal mode analysis results showing the lowest mode for the monomeric RacE2 (A) and the dimeric RacE2 (B). The two domains in the monomeric unit are shaded in pink and beige and the location of the active site is indicated by the presence of the catalytic cysteines shown in yellow. In each mode two frames representing the two extreme conformations are shown. One frame is in solid color and the other is in transparent grey. The large arrows aid in the visualization of the overall collective motions in the different modes. Dominant motions are hinge like motions about the catalytic site resulting in the opening and closing of the active site in the monomer (A). In the dimer (B) dominant motions are between the two monomers at the dimer interface. This figure was generated by PyMOL

