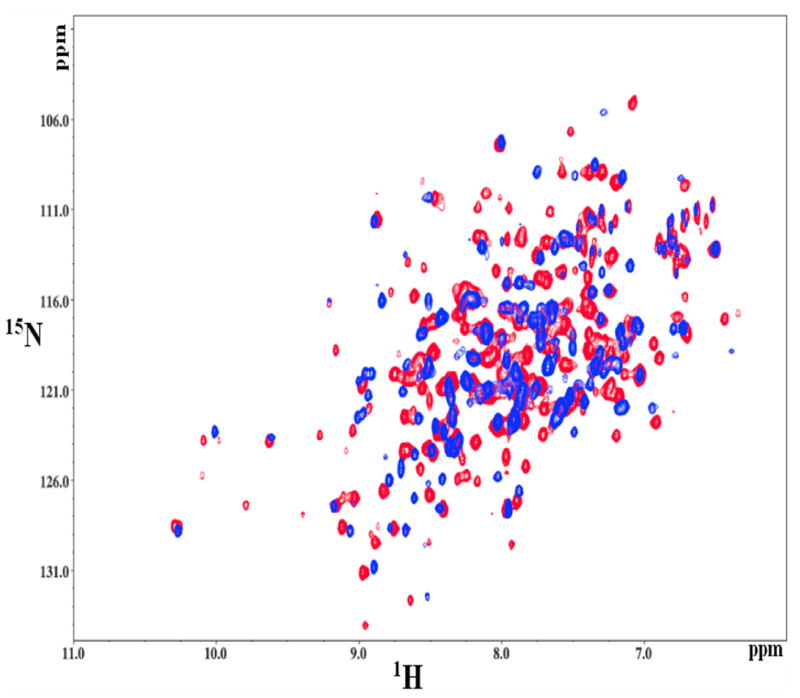
Figure 7.

Comparison of the substrate bound (red) and free (blue) RacE2_R25A HSQC. The spectra show significant perturbations in the chemical shifts of many resonances, along with the appearance of multiple additional resonances when the enzyme binds the substrate. Thus, there is a significant conformational change upon substrate binding.
