
Figure 2. TP1-nlacZ expression pattern during somitogenesis and in heart and arteries.
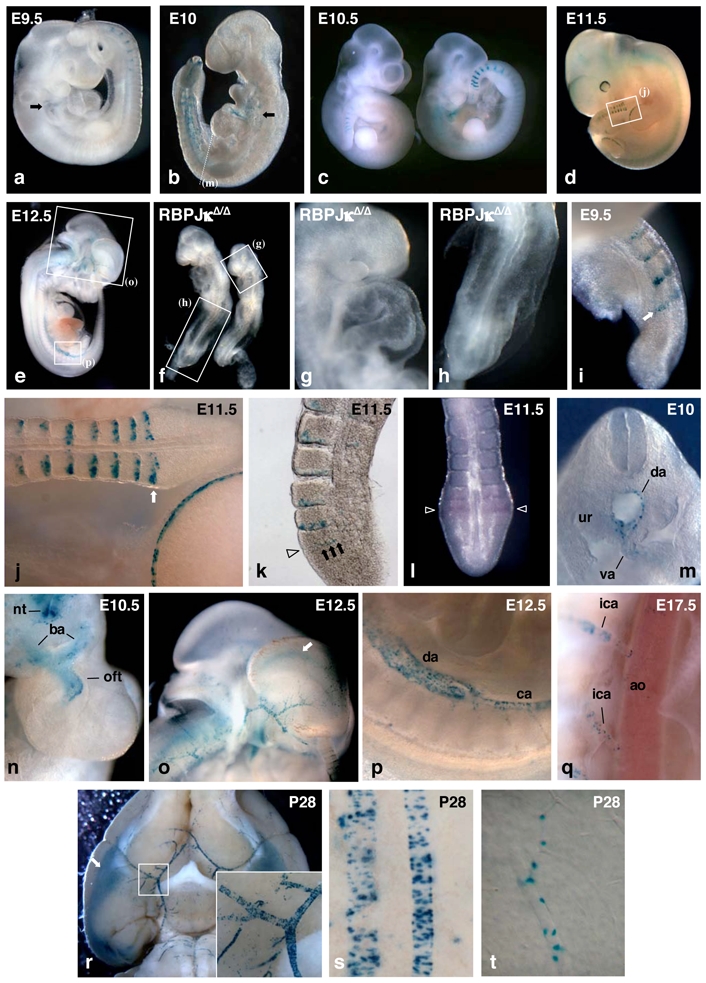
Whole mount X-gal staining of embryos of the following ages: E9.5 (a), E10 (b), E10.5 (c), and E11.5 (d). Arrows in (a,b) point to lacZ expressing cells in the cardiac region, (e) Internal view of a E12.5 NAS embryo cut in half, (f) RBP-JκΔ/Δ deficient embryos recovered 10 days after mating do not express the TP1-nlacZ transgene. Magnified views of regions indicated by boxes in (f) show the absence of IacZ expressing cells in cardiac (g) and tail (h) regions. Detail of the staining of the tail of E9.5 (i) and E11.5 (j, boxed region in (d)) NAS embryos. Arrows point to the band of β-gal positive cells in the PSM (k) Vibratome thick section of X-gal stained E11.5 tail showing a row of NAS expressing cells in the PSM (arrows) at the time when cleft starts to form (arrowhead). (l) Whole mount in situ hybridization of E10.5 tail showing that IacZ mRNA is detected essentially in the boundary forming region of the PSM (arrowhead). (m) Section in the trunk region (arrow in (b)) of E10 embryo showing TP1-nlacZ expression in the walls of dorsal aorta (da) and vitelline artery (va). ur: urogenital ridge. (n) Upper view of the heart region of E10.5 NAS embryo from which the head has been cut off. TP1-nlacZ expression is found in the distal portion of the outflow tract (oft) and in the branchial arch arteries (ba). nt: neural tube, (o–p) Enlarged views corresponding to boxed regions in (e) showing TP1-nlacZ expression in dorsal aorta (da) and caudal artery (ca) (p) and in head arteries (o) of E12.5 embryo. Arrow in (o) points to X-gal staining in the region of cortical hem (q) Detail of the X-gal staining of E17.5 NAS embryo. TP1-nlacZ expression is barely detectable in the dorsal aorta (ao) while it is clearly visible in the intercostal arteries (ica) branching directly from it. (r) Ventral view of dissected brain from a 4 weeks old NAS mouse showing the staining in cerebral arteries and in entorhinal cortex (arrow). Inset shows a magnified view of the branching of the right sylvian artery to the Willis polygon, (s–t) Details of pial arteries (s) and cerebral cortex microvessel (t) X-gal staining from 4 weeks old NAS mouse.