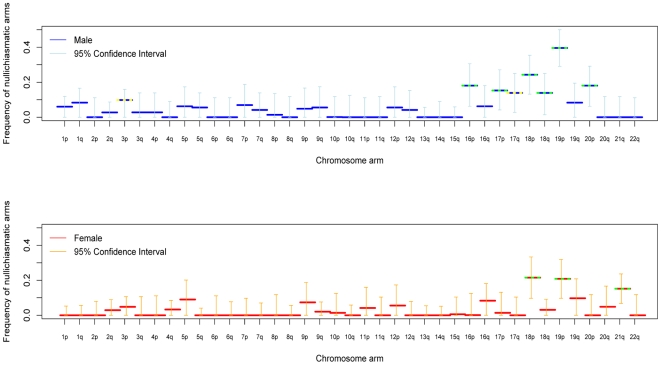
Figure 1. For each chromosomal arm, the estimated fraction of bivalents that segregated properly without a chiasma, in male (blue) and female (red) transmissions.
Shown are maximum likelihood estimates and 95% confidence intervals (see Methods). Estimates significantly above 0 at the 5% level are indicated by a yellow dotted line and at the 1% level by a green dotted line. The data for chromosome 21 combine two sets of pedigrees (see Methods).

