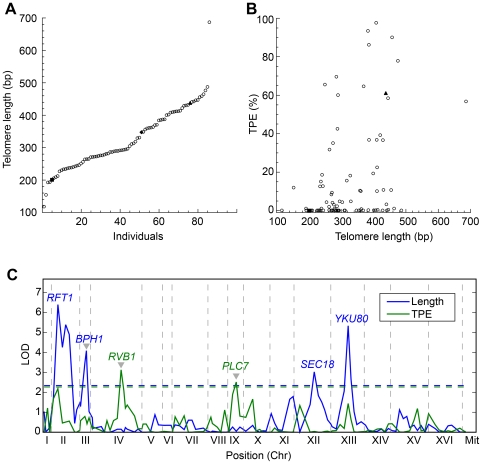
Figure 4. F1 spores phenotypes and linkage analysis.
(A) Telomere length distribution in 83 F1 spores (open circles), YPS (solid triangle), CBS (solid square), and the F1 hybrid (solid diamond). A continuum of lengths, consistent with many QTLs, is observed. (B) TPE and telomere length obtained from 83 F1 spores from CBS and YPS cross (open circles). Our results show that the two phenotypes weakly correlate (r = 0.39, linear equation). The two parental YPS (solid triangle) and CBS (solid square) are also shown. (C) LOD plot from linkage analysis for telomere length (blue) and TPE (green) using the normal model and the non-paramentric model respectively. Dashed lines indicate the 5% significance cutoff using 1,000 permutations. Markers with highest LOD in each interval are indicated. Gray arrow indicates QTLs having antagonistic effect.

