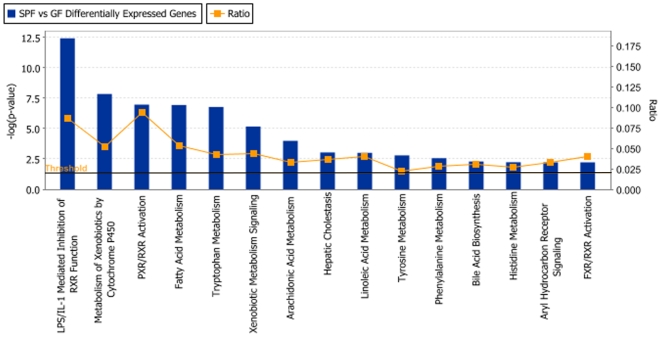
Figure 1. Canonical Pathways Analysis.
Shown are the top fifteen significant canonical pathways as determined by using the Ingenuity Pathway Analysis software (Ingenuity® Systems). The strength of the statistical association is indicated by the length of the bars. The ration value reflects the proportion of gene elements in the differentially abundant gene list that corresponded to genes in each pathway. The vertical line represents the threshold of the significance.

