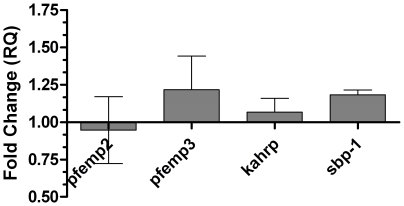
Figure 2. Analysis of expression of exported non-var genes upon exposure to 10 µM tBHP in NF-54 parasites.
Stress induction, cDNA production and qPCR analysis were performed as described in the legend to Fig. 1. Error bars represent mean of triplicates ± SEM.

