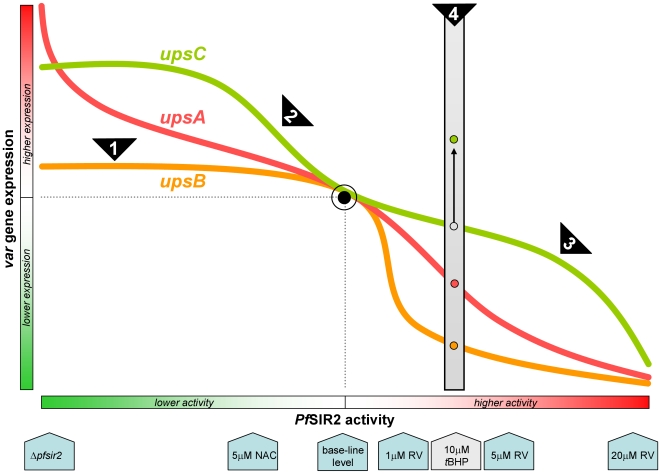
Figure 7. Schematic representation of the proposed theory of var modulation by pfsir2.
This schema summarizes the main findings and theories put forward in this work. pfsir2 plays a dominant role in var gene regulation, its level of activity differentially determining the extent of var gene expression. x axis represents pfsir2 activity, y axis represents relative var expression. This figure does not represent quantitative relationships. See text for further explanation. Arrowheads at bottom row show the main experiments involved in the establishment of this theory.

