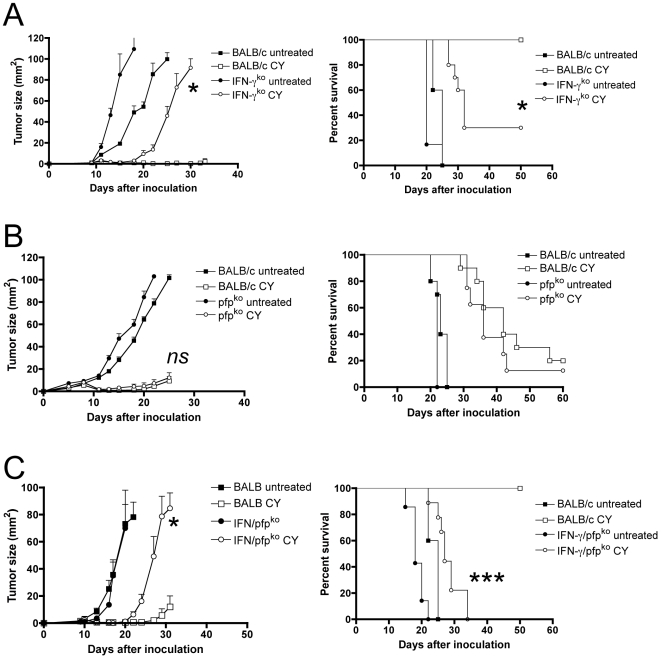
Figure 5. CD8 T cell effector mechanisms.
(A) Tumor growth and Kaplan-Meier survival curves in CY-treated IFN-γ-deficient mice and control mice. Data shown are mean±SEM (n = 5) from one experiment (growth curve, left panel) or total data from two experiments (survival curve, right panel). Tumor cells were inoculated at day 0, treated with CY at day 9. * P<0.05 when CY in immunocompetent mice and IFN-γ deficient mice is compared. (B) Tumor growth curves and Kaplan-Meier survival curves in CY-treated perforin-deficient and normal control mice. ns = not significant when CY in immuno-competent and perforin-deficient mice are compared. Tumor cells were inoculated at day 0 and treated with CY at day 8. ns, not significant. (C) Tumor growth and Kaplan-Meier survival curves after CY treatment in perforin/IFN-γ double-deficient mice, compared to immunocompetent mice. Data shown are mean±SEM (n = 5) from one experiment (growth curve, left panel) or total data from two experiments (survival curve, right panel). Tumor cells were inoculated at day 0 and treated with CY at day 9. * P<0.05, *** P<0.001 when BALB/c + CY is compared with IFN-γ/pfp-ko + CY.

