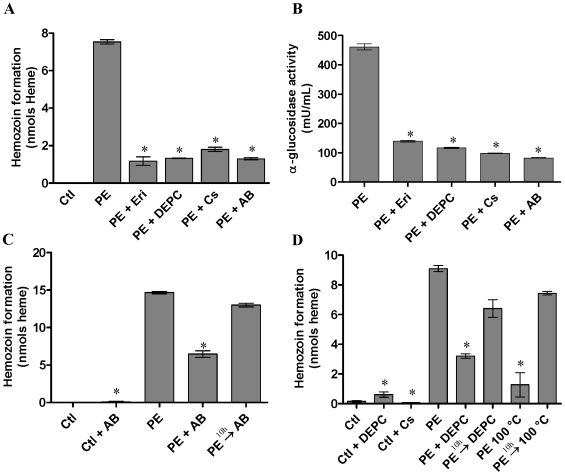
Figure 1. Hz formation and α-glucosidase activities in the presence or absence of inhibitors in vitro.
A. C. and D. Hz formation. B. α-glucosidase activity. Ctl - hemin; PE - protein extract of midgut epithelium; PE + Eri - protein extract + erythritol; PE + DEPC - protein extract + diethypyrocarbonate; PE + Cs - protein extract + castanospermine; PE + AB - protein extract + anti D. peruvianus α-glucosidase antibody; Ctl + AB - hemin + antibody; Ctl + Cs - hemin + castanospermine; Ctl + DEPC - hemin + diethypyrocarbonate; PE → AB - protein extract + antibody 10 hours after starting assay; PE → DEPC - protein extract + diethypyrocarbonate 10 hours after starting assay; PE 100°C - protein extract boiled for 10 min before starting assay; PE → 100°C - protein extract boiled 10 hours after starting assay. The assays of Hz formation were carried out for 24 h at 28°C as described in materials and methods. Hz formation activity was expressed as nmol heme aggregated in 24 h for 15 µg protein extract. The assays of α-glucosidase activity were determined using a colorimetric method. Unless otherwise indicated, activity was expressed as nmol ρ-nitrofenolate released in 1 min. Results shown are means ±SEM (n = 4) of two experiments run in triplicate. The experiments with inhibitors were significantly different from protein extract alone *(P<0.05).

