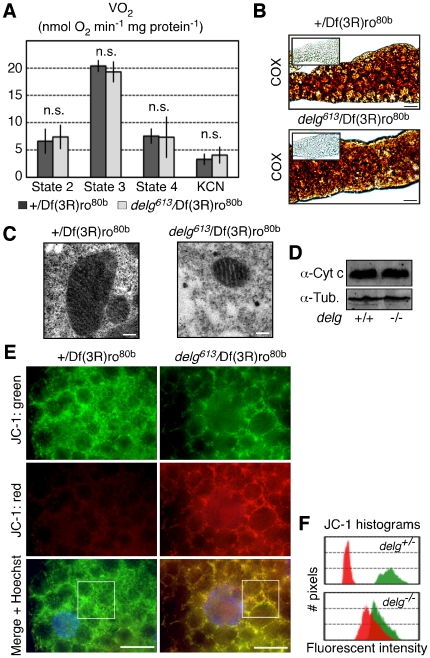
Figure 5. Normal mitochondrial activity in delg mutant fat bodies.
(A) Oxygen consumption assays on digitonin-permeabilized dissected fat bodies as done in Fig. 1D. (B) Cytochrome c oxidase (COX) staining in larval fat bodies. The addition of COX-inhibitor KCN shows the specificity of the stain (shown as insets). (C) Electron microscopy images, showing normal cristae in delg mutants. (D) Western blot using larval fat body extracts, showing similar Cytochrome c levels in both genotypes. Anti Tubulin was used as a loading control. (E) JC-1 stainings in unfixed fat bodies. The predominant green signal in the heterozygous control indicates low mitochondrial membrane potential. The red signal in the delg mutant indicates high potential. White boxes outline the areas used for the histograms shown in F. (F) Quantification of JC-1 histograms, showing the intensity of red and green fluorescence. Bar equals 20 µm, except 0.2 µm in E.

