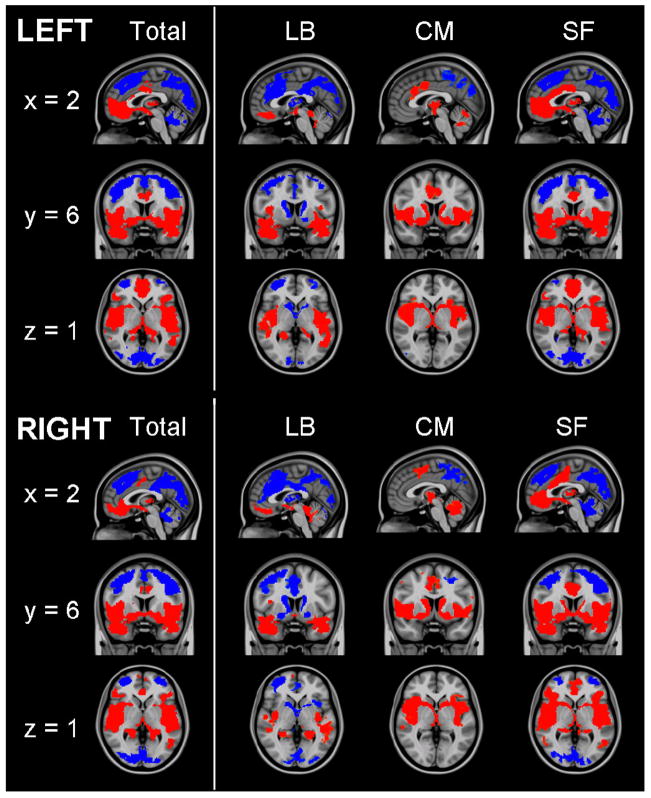
Figure 2.
Functional connectivity of amygdala regions of interest. Patterns of significantly positive (red) and negative (blue) relationships for the total amygdala, laterobasal (LB), centromedial (CM) and superficial (SF) subdivisions. Sagittal (x = 2), coronal (y = 6), and axial (z = 1) views are presented. (MNI standard space; radiological convention; Z > 2.3; cluster significance: p < 0.05, corrected).

