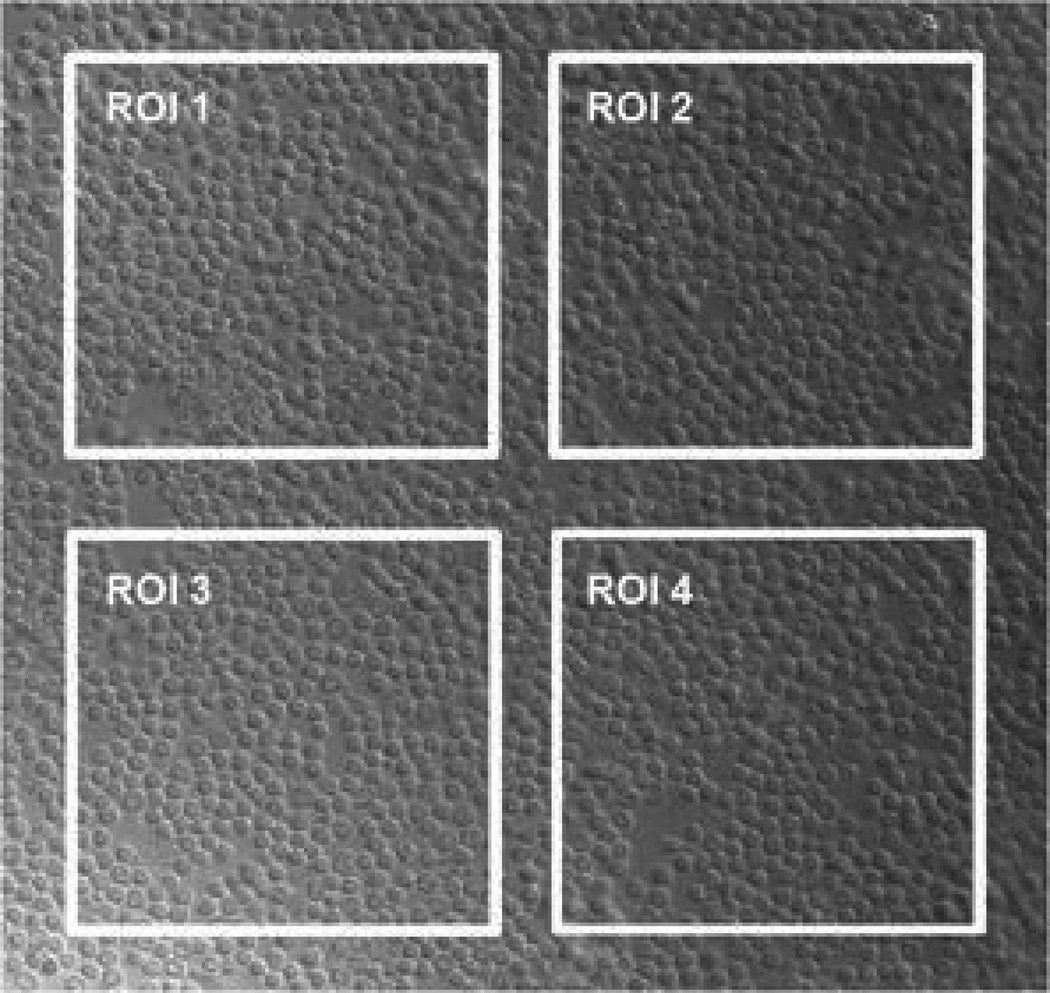
Figure 1. Differential interference contrast (DIC) image of normal resting T-cells.
T-cells (0.6 × 10⁶) were cyto-spun onto slides so that they were greater than 95% confluent. A field was selected that was absent of debris, and four regions of interest (ROI) were selected over which autofluorescent intensity could be measured. Note that for simplicity, all ROIs are of equal size and shape. However, all sizes and shapes can be chosen and directly compared to one another since the reported measure is an average intensity defined over the entire ROI.

