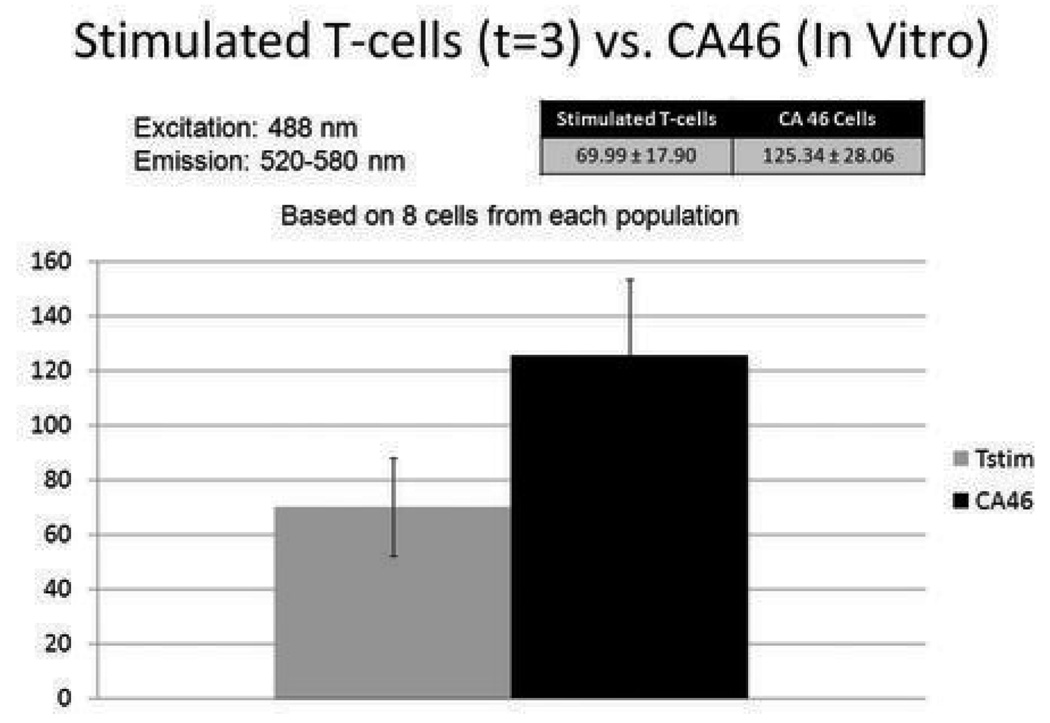
Figure 3. Autofluorescence of stimulated T-cells and malignant B-cells (CA46).
Stimulated T-cells and CA46 cells were separately stimulated with 488 nm light and emissions were measured over wavelengths ranging from 520 to 580 nm. The two populations of cells were clearly distinguished from one another using this method. Averaged signal data from as few as 8 cells was required to make this determination.

