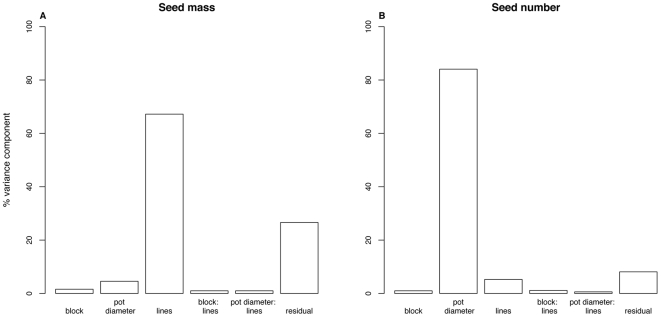
Figure 2. Results of a variance components analysis of harvested seed mass (A) and seed number (B).
Variance components are expressed as percentages of the total in each case. Note that seed mass shows a large genetic component (variation among lines) whereas seed number shows a large environmental component (variation among pot sizes).

