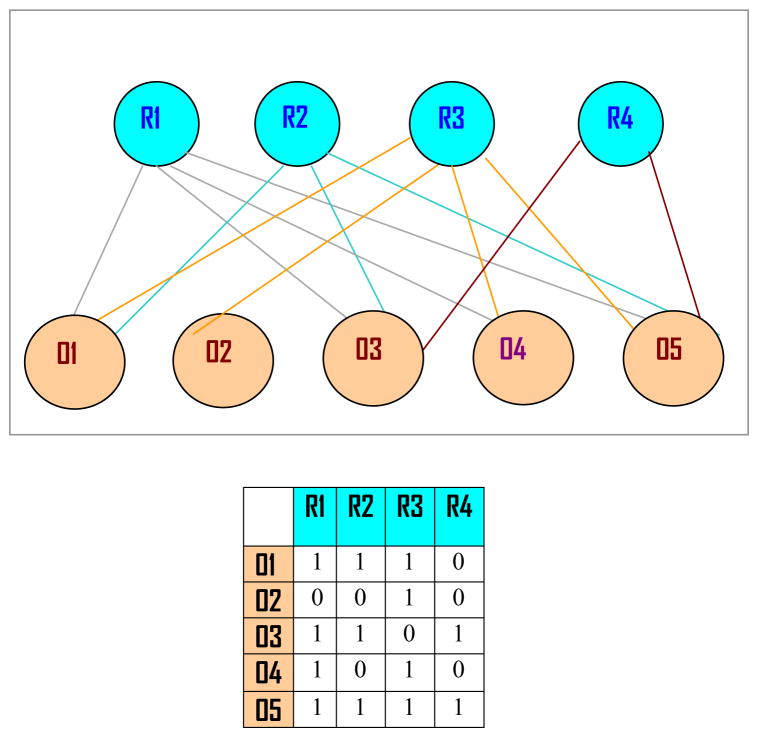
FIGURE 1. A Pictorial Example for Network Design.
Depicted in the upper part is a bipartite network between four regulatory agents (gene knock-outs, drugs etc.) denoted by R1 through R4 and five outputs (e.g., growths of certain organisms) designated with O1 through O5. Connections between regulatory nodes and output nodes are shown as usual. The rectangular table just underneath the network represents the connectivity matrix B with columns corresponding to regulatory agents and rows to outputs. The regulatory matrix C is not shown in the picture. When there are no connections between output nodes (rows) and regulatory nodes (columns), the corresponding cells contain zero. Obviously, all other cells are composed of ones for the network shown here.

